R - Making a Simple Treemap
Hi !
I think you have understood that I find a representation of data in the form of a treemap very good.
But how to do it in a simple way with the R language? When I say simple, this is because I use the features in a basic way.
Here is the entire code:
#!/usr/local/bin/Rscript
library(treemap)
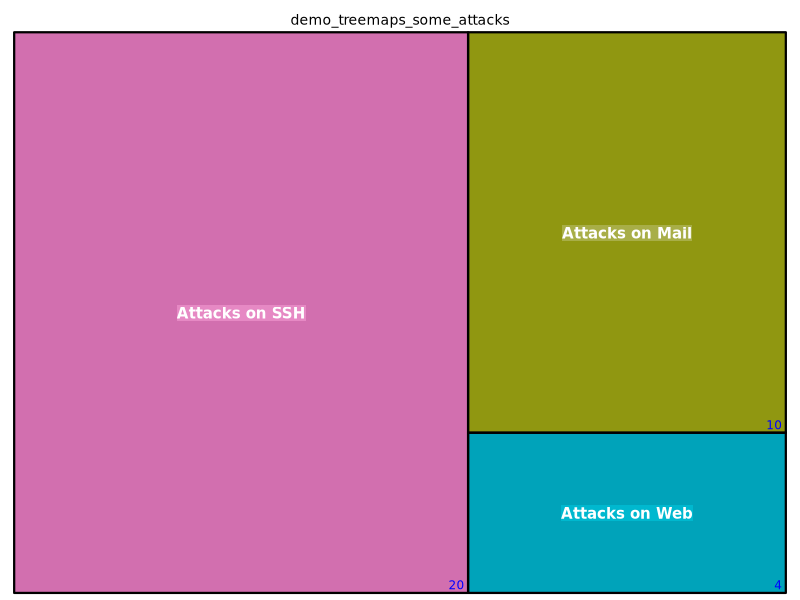
group <- c("Attacks on SSH","Attacks on Web","Attacks on Mail")
subgroup <- c("20","4","10")
value <- c(20,4,10)
ttitle=paste("demo_treemaps_some_attacks")
OutputFilename <- sprintf("./demo_some-attacks_using_treemaps.png")
png(width=800,height=600,file=OutputFilename)
data <- data.frame(group,subgroup,value)
treemap(data,
index=c("group","subgroup"),
vSize="value",
type="index",
fontsize.labels=c(15,12),
fontcolor.labels=c("white","blue"),
fontface.labels=c(2,1),
overlap.labels=0.5,
inflate.labels=F,
align.labels=list(
c("center", "center"),
c("right", "bottom")
),
title=ttitle
)
dev.off()
Let’s try to break down the process I use.
First, here is the standard way to launch a script under Unix (here the R interpreter instead of any shell).
#!/usr/local/bin/Rscript
We declare the use of the treemap library (I pass on the installation of this one).
library(treemap)
The definition of the image:
- The image title ;
- The name of the generated file ;
- The definition of the file (in the sense of image format/size).
ttitle=paste("demo_treemap_some_attacks")
OutputFilename <- sprintf("./demo_treemap_some_attacks.png")
png(width=800,height=600,file=OutputFilename)
We are now getting down to business, the definition of treemap data. Simply three vectors made up of:
- The group indicates the title of each of the blocks ;
- The subgroup represents what the group is ;
- The values of each group (which will influence the size of the groups).
group <- c("Attacks on SSH","Attacks on Web","Attacks on Mail")
subgroup <- c("20","4","10")
value <- c(20,4,10)
We define a dataframe with the content of the values of the three vectors previously defined.
data <- data.frame(group,subgroup,value)
We call the treemap() function with different parameters. I’m not going to go into detail about everything that’s available.
"help(treemap)" is your friend within the R interpreter.

treemap package:treemap R Documentation

Create a treemap

Description:

      A treemap is a space-filling visualization of hierarchical
      structures. This function offers great flexibility to draw
      treemaps. Required is a data.frame ('dtf') that contains one or
      more hierarchical index columns given by ‘index’, a column that
      determines the rectangle area sizes (‘vSize’), and optionally a
      column that determines the rectangle colors (‘vColor’). The way
      how rectangles are colored is determined by the argument ‘type’.

Use:

      treemap(
        dtf,
        index,
        .
        .
        .
      )
Here is the detail about the call to the function.
treemap(data,
    index=c("group","subgroup"),
    vSize="value",
    type="index",
     fontsize.labels=c(15,12),
     fontcolor.labels=c("white","blue"),
     fontface.labels=c(2,1),
     overlap.labels=0.5,
     inflate.labels=F,
     align.labels=list(
        c("center", "center"),
        c("right", "bottom")
     ),
     title=ttitle
)
We close the image.
dev.off()
Here is the result:
In a future post, we will move on to making a slightly more complex treemap.
Regards