R - Making a Slightly More Complex Treemap
Hi !
A few months ago, I indicated that I wanted to show a way to represent treemaps in a slightly more advanced form.
Imagine that we want to represent the average values (load) of an Unix computer over a period of 9 hours.
Remember we are talking about:
- The first value shows the average load on the CPU for the last minute.
- The second depicts the average load for the last 5-minute interval
- The third value gives us the 15-minute average load
Here is the full ‘R’ script, we will detail it a little further down.
# Some options
# ------------

options(warn=1)


# Calling library
#----------------

library(treemap)

df1 <- data.frame(
      col1  = c(2,3,5,2,5,9,4,4,5),
      col5  = c(6,2,3,1,3,15,3,1,4),
      col15 = c(3,4,5,3,4,7,2,5,6)
      )

colnames(df1) <- c('L1m','L5m','L15m')
row.names(df1) <- c('0h','1h','2h','3h','4h','5h','6h','7h','8h')

vV_group <- c(rep("0h",3),rep("1h",3),rep("2h",3),rep("3h",3),rep("4h",3),rep("5h",3),rep("6h",3),rep("7h",3),rep("8h",3))

vV_temp <- c("Load 1m","Load 5m","Load 15m")

vV_subgroup <- c(rep(vV_temp,9))

vV_value <- as.vector(t(df1))

df2 <- data.frame(vV_group,vV_subgroup,vV_value)

OutputFilename <- sprintf("demo_treemap_with_subgroups.png")
ttitle <- ("Demo Treemap with subgroups")

png(width=1024,height=768,file=OutputFilename)

treemap(df2,
        index=c("vV_group","vV_subgroup"),
        vSize="vV_value",
        type="index",
        align.labels=list(
            c("center", "center"),
            c("right", "bottom")
        ),
        title=ttitle
)

dev.off()
Let’s take a closer look.
We define a dataframe. Each line will represent respectively the different loads over 1,5,15 minutes.
df1 <- data.frame(
      col1  = c(2,3,5,2,5,9,4,4,5),
      col5  = c(6,2,3,1,3,15,3,1,4),
      col15 = c(3,4,5,3,4,7,2,5,6)
)
Assigning names to the columns/rows of the data frame.
colnames(df1) <- c('L1m','L5m','L15m')
row.names(df1) <- c('0h','1h','2h','3h','4h','5h','6h','7h','8h')
A vector for holding data: a total of 9 hours with 3 measures in each.
vV_group <- c(rep("0h",3),rep("1h",3),rep("2h",3),rep("3h",3),rep("4h",3),rep("5h",3),rep("6h",3),rep("7h",3),rep("8h",3))
A temporary vector for naming subgroup (see below)
vV_temp <- c("Load 1m","Load 5m","Load 15m")
A vector equal to [ 9 (number of groups) * the temporary vector defined above].
vV_subgroup <- c(rep(vV_temp,9))
We convert the dataframe to vector. Please note that we use the t() function to transpose the data frame.
vV_value <- as.vector(t(df1))
We define a new dataframe which will be used by the treemap() function.
df2 <- data.frame(vV_group,vV_subgroup,vV_value)
Let’s define the filename we are going to use.
OutputFilename <- sprintf("demo_treemap_with_subgroups.png")
ttitle <- ("Demo Treemap with subgroups")
Preparing output.
png(width=1024,height=768,file=OutputFilename)
Drawing treemap.
treemap(df2,
        index=c("vV_group","vV_subgroup"),
        vSize="vV_value",
        type="index",
        align.labels=list(
            c("center", "center"),
            c("right", "bottom")
        ),
        title=ttitle
)
We close the image.
dev.off()
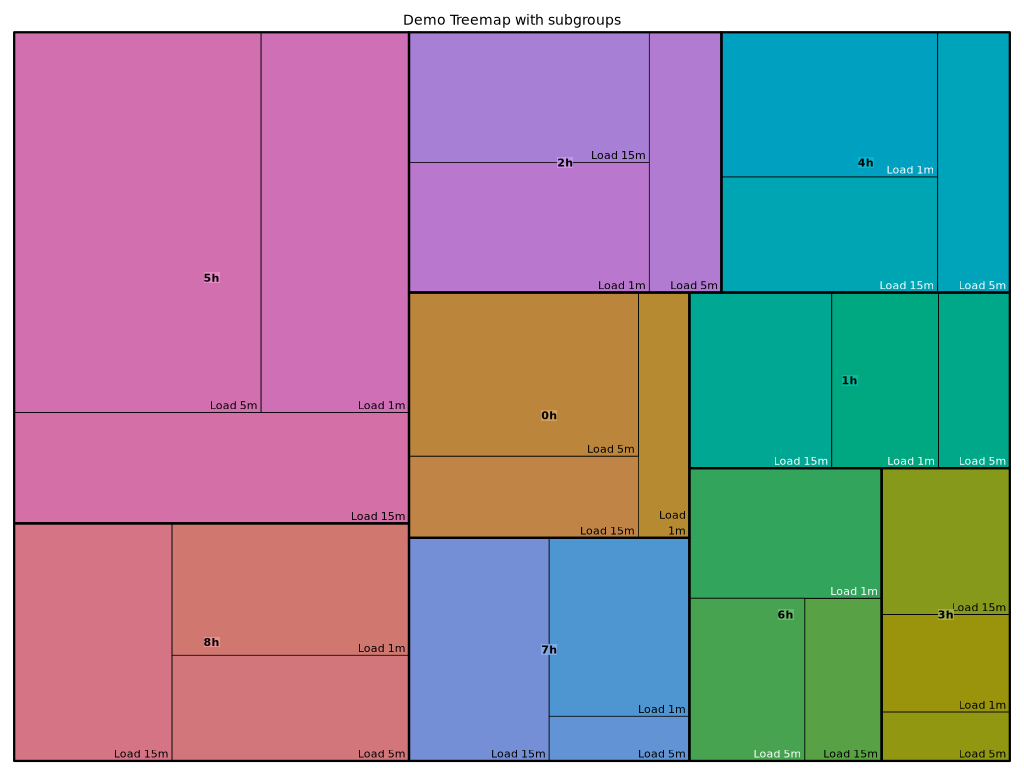
Here is the result.
Regards.