Zeek + R - Geographic Origins of Connections to a Tor Relay
Hi !
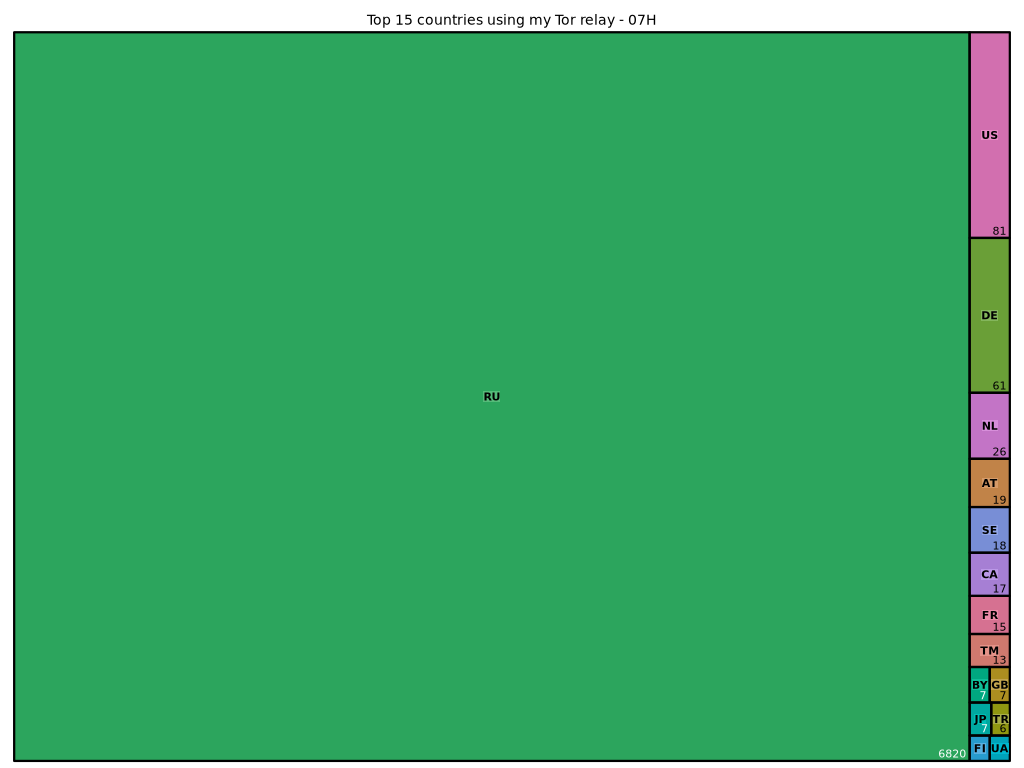
Let’s use Zeek to see the geographic origins of connections to a Tor relay. Of course, I will use a Treemap representation to visualize things.
First of all, and I would like to point out, this server (the one you are connected to) is not part of the Tor network. It is just used to display data from elsewhere. Another point to clarify, I am not going to present the Tor network. For those interested in finding out more, go to the following site https://www.torproject.org/
I’m also not going to go into detail about why I’m running a tor relay. I’m just going to say that this was basically a test project to use FreeBSD jails.
Here is an extract of the file “conn.log” built by Zeek.
1702502264.272342       CCMTN2fsuxW7EM3Fc       x.y.z.t 47926   10.0.0.2    9001    tcp     ssl     1315.759275     2680    2680    SF      F       T       0       DadAfF  11      32512       3304    -       FR      -       -       48.8582 2.3387  -       -       -       -       -
1702502523.754661       CQ15Rx4bnH9We1d6Vj      x.y.z.t 55254   10.0.0.2    9001    tcp     ssl     419.463806      34912   4970    SF      F       T       0       ShADdaFf        74 38768    73      8774    -       MD      CU      Chisinau        47.0042 28.8574 -       -       -       -       -
Now a shell script to extract the countries the connection are coming from.
#!/bin/sh

cat conn.log | awk '{if (($3!='x.y.z.t') && ($6=='9001') && ($12~/SF/) && ($22~/../)) print $22}' >> tor_countries.log
Then count them.
#!/bin/sh

cat tor_countries.log | sort | uniq -c | sort -rn | sed -e 's/^[\t]*//' | head -n15 > tor_countries.txt
Exemple of input: tor_countries.log
US
US
US
AT
DE
US
CA
DE
SE
US
Exemple of output: tor_countries.txt
125 US
106 DE
33 NL
32 AT
29 FR
27 CA
Now graph them using an “R” script.
#!/usr/local/bin/Rscript

library(treemap)

F_GetDate <- function(localpath) {
    MyDate <- Sys.Date()
    today_date <<- format(MyDate, format="%b %d")
    MyTime <- Sys.time()
    actual_time <<- format(MyTime, format="%H")
}

F_ReadFile <- function(localpath) {
    conn <- 0
    print("File to open:")
    print(localpath)
    res <- tryCatch({ conn <- file(localpath,open="r")

    	}, warning=function(w) {stop("Warning")

    	}, error=function(e) {stop("Erreur, cant read file !!")}
    )

    return(conn)
}

F_GetDate()

args <- commandArgs(trailingOnly = TRUE)
path <- args
print("File= ")
print(path)
conn <- F_ReadFile("tor_countries.txt")
lines <- readLines(conn)
close(conn)

ttitle <- ""

OutputFilename <- sprintf("tor_countries.png","")

group <- c()
subgroup <- c()
value <- c()

for (i in 1:length(lines)){
    lline <- unlist(strsplit(lines[i], " "))
    occurence <- as.numeric(lline[1])
    country <- lline[2]
    vS_group <- country
    group <- append(group,vS_group)
    value <- append(value,occurence)
    subgroup <- append(subgroup,as.character(occurence))
}

data <- data.frame(group,subgroup,value)

png(width=1024,height=768,file=OutputFilename)

ttitle <- paste("Top 15 countries using my Tor relay"," - ",toString(actual_time),"H",sep="")

treemap(data,
        index=c("group","subgroup"),
        vSize="value",
        type="index",
        align.labels=list(
            c("center", "center"),
            c("right", "bottom")
        ),
        title=ttitle
)
Here is the result.
Regards.